2025年11月1日土曜日

VERGE 25参加レポート:データセンターのサステナビリティ課題を企業が「逆ピッチ」

VERGE 25で「Corporate Reverse Pitch for Data Centers: What Climate Leaders Need Built Now(データセンター:気候リーダーが今求めるソリューション)」というセッションに参加しました。

このセッションの面白いところは、通常のスタートアップが企業にピッチする形式ではなく、企業のリーダーたちが起業家や投資家に向けて自社のサステナビリティ課題をピッチするという「逆ピッチ」形式だったことです。

パネリストが提示した主な課題

HPE(Monica Bachelder氏、Chief Sustainability Officer)

  • クリーンエネルギーの可視化 - サーバーやワークロードレベルでの再生可能エネルギー利用状況の把握と最適化
  • ソフトウェア効率性の測定 - AIモデルが実際にどれだけのコンピューティングリソースを消費しているかの測定
  • 人材育成プログラム - AIとサステナビリティの両方を理解できる人材の育成

Amazon Devices(Juliette Devaney氏)

  • プリント基板の革新 - アディティブ・マニュファクチャリング(積層造形)によるプリント基板ソリューション
  • 低炭素材料 - デバイス部品への低炭素材料の活用
  • エネルギー効率 - 熱管理、ディスプレイ、バッテリーにわたるエネルギー効率の向上

Equinix(Greg Metcalf氏)

  • 熱回収システム - データセンターの廃熱を地域暖房に供給するシステム
  • スペースと都市統合 - 限られた空間での熱回収システムの実装と都市環境への統合
  • 経済性の課題 - 米国では天然ガス価格が低いため、熱回収の経済的メリットが出にくい問題の克服

National Grid Partners(Aaron Panzer氏)

  • フレキシブル接続ソリューション - 年間5%のピーク需要期間に対応するための柔軟な電力接続
  • 運用ツール - 電力網上の変動負荷を管理するための運用ツール
  • モバイル/バッテリーソリューション - より迅速な相互接続を実現するためのモバイル・バッテリーソリューション
  • 長期インフラ計画システム - 長期的なインフラ計画を支援するシステム

スタートアップとの協業方法

各社は、スタートアップとの協業方法についても共有してくれました。パイロットプログラムや共同イノベーション、VC投資、そしてentrepreneur-in-residence(社内起業家)プログラムまで、多様な協業の形があることがわかりました。

所感

解決すべき具体的な課題が明確に示されたことで、起業家や投資家にとって非常に有益なセッションでした。今後もこのようなセッションが増えてくると面白いなと思います。

2022年2月9日水曜日

VC firms started to look their own figure through the ESG/sustainability mirror

Several well-known Venture Capital firms have recently started publishing their sustainability reports. 

In a previous article, I wrote that the characteristics and strengths of companies can be identified by reading sustainability reports and analyzing sustainability data. This is even more true for VC firms. For VCs, there is no standardization for ESG/sustainability data disclosure, so they decide for themselves what data to disclose and design the sustainability report more freely than companies whose shares are publicly traded.


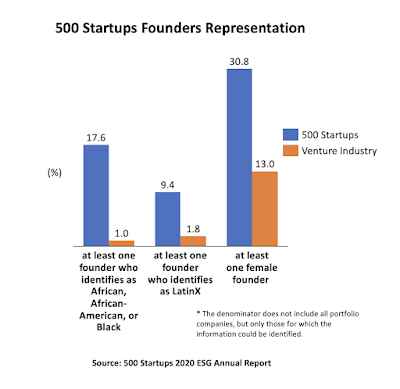
I recently read a sustainability report from 500 Startups. Since they have accelerator programs in several countries and invest in startups globally, they proudly report on the diversity of their portfolio company founders. According to the ESG report, 30.8% of their portfolio companies have at least one female founder (the industry average is 13%), 17.6% of portfolio companies have at least one Black/African/African-American founder (the industry average is 1.0%).

Another impressive sustainability report I read was from Energy Impact Partners.


The report comprises 73 pages and contains a large amount of detailed data on the portfolio companies. Not only aggregated figures are disclosed, but also the raw data of the individual portfolio companies. One of the data that I found interesting was the turnover rates (the average total turnover rates of the portfolio companies was 23%) - by looking details of the turnover rates, I could see the impact of COVID-19 on the startups. 


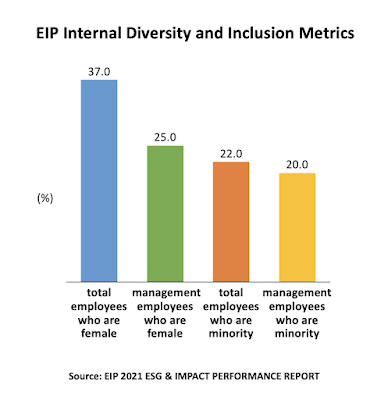
What stands out from others is that Energy Impact Partners also discloses their own organization's carbon footprint and diversity metrics. I think that's very progressive. According to the report, the percentage of female employees at EIP is 37%.


There is often criticism that the VC industry lacks diversity (lack of gender, racial diversity etc.). With the publication of sustainability reports, VC firms have started to look not only at the sustainability and impact of their portfolio companies, but also at their own sustainability, and I think that's a great thing for the industry as well.

2021年4月15日木曜日

How to prioritize sustainability initiatives - examples of materiality matrix

There are many ESG initiatives that seem so important to companies, but corporate resources are limited, so trade-offs often have to be made. Balancing long-term environmental and social impacts with short-term profits is one of the biggest challenges for companies. Another example I've seen in conversations with companies was the reduction of Scope 3 GHG emissions versus supplier benefits. One of the ways to prioritize these ESG initiatives is to assess materiality. For reference, I have put together some examples of the materiality matrix from recent corporate sustainability reports. I found that Altria, a tobacco company, has done this materiality assessment on a large scale. They surveyed 9500 people who are stakeholders, such as employees, consumers, growers, suppliers, trading partners, government officials, communities, NGOs, etc. They spend 4 pages explaining the methodology in their sustainability report. If you look at GM's materiality matrix, it says that developing the electric vehicle market is most important, and they use the matrix to support their corporate strategy, which focuses on electric mobility and sends clear messages to readers. Conducting a materiality analysis and communicating about it in sustainability reports becomes very important.


1, Altria 2020 Materiality Matrix


Source: Altria Engage and Lead Responsibility: 2020 - 2021 (P.14) 


2, GM 2019 Materiality Matrix

 Source: GM 2019 Sustainability Report (P.32)


3, PG&E Materiality Matrix (2017)


4, American Express Materiality Matrix


5, eBay Materiality Matrix

Source: eBay Impact 2019 Report  (P.7)

2021年2月5日金曜日

How environment friendly are the auto makers ? (comparison of sustainability data)

President Biden recommitted the United States to the Paris climate agreement. "Green New Deal"-type stimulus to recover from COVID-19 is being considered not only in the U.S., but also in many other places around the world. As environmental awareness increases, it appears that corporate efforts to reduce greenhouse gas emissions will accelerate in the coming years. 


This time, I compare automobile companies because GHG emissions from the transportation sector are significant and automobile manufacturers play an important role in this. 


First, I compared GHG emissions data from three automakers, Toyota, Volkswagen, and GM, that have disclosed detailed GHG emissions data in their environmental reports. (I also checked Daimler, Ford, and Tesla, but I could not find specific Scope 3 GHG emissions data in their sustainability reports.)


  • Scope 1 emissions - direct emissions including on-site fuel combustion
  • Scope 2 emissions - indirect emissions such as purchased electricity, heat and steam. 
  • Scope 3 emissions - all other indirect emissions from their value chain, including the purchase of materials and parts, use of sold products etc. 

Scope 1 and Scope 2 emissions are emissions from corporate activities. Compared to Scope 1 and 2, Scope 3 emissions are difficult to calculate but very important to capture the carbon footprint.
 
Looking at the CO2 emissions intensity (Scope 1 emissions + Scope 2 emissions per vehicle), the comparison is as follows.

Toyota has a much lower level of Scope 1 emissions compared to other companies. According to its environmental report, this is achieved by introducing innovative technologies and promoting energy savings through daily kaizen. The company plans to achieve zero CO2 emissions at its global plants by 2050.

In terms of water consumption per unit, Toyota's figure seems slightly better. 


When it comes to the use of renewable energies, Volkswagen is ahead of the game. They already achieved 41% renewable energy in their electricity consumption, while Toyota and GM achieved 12% and 22% respectively.

We can see the strengths of each company by comparing their environmental data. For example, Toyota seems to be good at saving energy and improving energy efficiency, and Volkswagen seems to be good at utilizng renewable energy. 

In the future, we can expect the amount of data disclosed in environmental reports to increase. By comparing different KPIs, we may continue to identify companies' characteristics and strengths.

Source:
https://global.toyota/pages/global_toyota/sustainability/report/er/er20_en.pdf
https://www.volkswagenag.com/presence/nachhaltigkeit/documents/sustainability-report/2019/Nonfinancial_Report_2019_e.pdf
https://www.gmsustainability.com/_pdf/resources-and-downloads/GM_2019_SR.pdf
https://www.tesla.com/ns_videos/2019-tesla-impact-report.pdf
https://global.toyota/en/company/profile/production-sales-figures/201912.html

2021年1月27日水曜日

How environment friendly are the GAFA companies? (Comparison of Renewable Energy)


It seems that GAFA investments in renewable energy will continue to grow in the coming years.


Recently I had the opportunity to look at the ESG reports of GAFA companies (Google, Apple, Facebook, Amazon) and found some interesting facts by comparing numbers. 


First, I compared the percentage of renewable energy in their electricity consumption. Google and Apple achieved a rate of 100% renewable energy on their electricity consumption in 2019. Facebook and Amazon reached 86% and 42% respectively.


Amazon's share of renewable energy in electricity consumption is significantly lower than other companies. Amazon has set a goal to use "100% renewable energy" by 2025, so major investments in renewable energy are expected in the coming years. 

Comparing contracted renewable capacity, it appears that Google maintains its lead, although Facebook added 1.7 GW of contracts in 2019. (Edit: Amazon revised its sustainability report and claims they have 6500MW of solar and wind projects as of Dec 2020.)

Because Apple does not manufacture products in its own facilities, the amount of renewable energy used in Apple's own facilities is relatively small. According to Apple's report, 75% of its carbon footprint comes from product manufacturing. Therefore, Apple introduced the Supplier Clean Energy Program in 2015, and now the renewable energy capacity at Apple suppliers is significant. Apple recently set a more ambitious goal to "transition our entire manufacturing supply chain to 100 percent renewable power by 2030," so renewable energy investment at Apple suppliers is expected to continue growing.

Since 2010, Google has invested "nearly $2.7 billion in large-scale renewable energy projects with an expected total combined capacity of approximately 4.6 GW". (The figure excludes Power Purchase Agreements for their operation.) 

I also looked at the time series data of Google's renewable electricity purchased and found that it grew rapidly over the 2013-2018 period.

As Google's electricity consumption is expected to continue to increase in the coming years, Google's investment in renewable energy is also expected to increase.
  
The installation of EV charging ports at Google also increased at a fast pace. 

Google employees can charge electric vehicles for free as part of their benefits, which has helped reduce greenhouse gas emissions from commuting. Google has installed 2,722 EV charging ports at its U.S. offices through 2018, and Apple has installed more than 2,300 EV charging stations through 2019. 

Speaking of electric vehicles, Amazon announced that it has ordered 100,000 new electric delivery vehicles from Rivian, a U.S. electric vehicle manufacturer, in September 2019. (Amazon led a $700 million round of investment in Rivian in February 2019.)

Although these companies have different business models, they are aggressively committing to reducing GHG emissions and are very good at disclosing the information in their environmental reports. 

Source:
https://rebuyers.org/blog/reba-announces-top-10-u-s-large-energy-buyers-in-2020-2/
https://sustainability.aboutamazon.com/pdfBuilderDownload?name=sustainability-all-in-december-2020

2020年12月16日水曜日

COVID19で2020年は二酸化炭素排出量が記録的に減少

12月11日に GCP (Global Carbon project)が出した最新の論文によると、COVID19の影響で2020年には世界の化石燃料由来のCO2排出量が24億トン減少し全体で約34 Gtとなり、2019年に比べて7パーセントの減少となったそうです。


この減少量は、世界の道路から500万台の自動車を削減したのと同等量とのことです。排出量の減少は特に交通分野で顕著で、道路交通と航空交通分野での排出量は、世界全体で2019年と比較してそれぞれ約10%、40%の減少。また、ロックダウンのピーク時には自動車の走行を含む地上交通からの排出量は、約半分に減少しました。


このベイエリアでも、3月にロックダウンが始まってからはそれまでの朝・夕方の交通ラッシュが嘘のように、高速道路が空いています。1日中渋滞していることで有名だったロサンゼルス市も、ロックダウン中は車が著しく減少しているそうです。


排出量の減少が顕著だったのは米国(12%減)とEU27カ国(11%減)。一方、中国では1.7%の減少に留まったとのこと。またイギリスでは13%減少、インドでは9%の減少が見込まれています。


ちょうど米国では来年からバイデン大統領が就任、そして欧州でのグリーンニューディールや市のレベルでのグリーン・ニューディールの広がりもあることから、COVID-19からの経済回復と共に、引き続き排出量の削減、が多くの地域で目指されることになるでしょう。

2020年11月25日水曜日

ロサンゼルス市のグリーンニューディールとスマートシティ・ネットワーク

 先日、スタンフォード大学主催のエネルギーセミナーで、ロサンゼルス市のグリーンニューディールについての話がありました。興味深い内容でしたので、簡単に内容を纏めておきます。


ロサンゼルス市は電力、ビル、交通、廃棄物、水の5つの分野で積極的な目標を定めています。2045年までに電力を100%再生可能エネルギーに、そして2050年までに全てのビルでNet-zero Carbonを実現&市内の車の全てをZero Emission Vehicleに、と非常にアグレッシブな目標を掲げています。


また、これらの目標の実現を通じて、2035年までに30万の雇用、2050年までに40万の雇用を生み出すとしています。


以前から力を入れている港のグリーン化にも引き続き力を入れていく予定で、トラクターやトラックの電動化を進めていきます。


特に面白いと思ったのは、アメリカや世界においてグリーン政策を推し進める市長ネットワークの存在です。「Climate Mayors」というネットワークでは米国の48の州から468の市長が参加していて情報共有をしており、また、「C40 Cities」には世界の97の大都市が参加して、グローバルなグリーンニューディールに向けた議論・取り組みを行なっているとのことです。


スマートシティを推進する市がネットワークを構築し、良い活動を他の市も取り入れていくことで、取り組みが世界に広がっていく。その動きは今後、益々加速していきそうです。

2020年8月5日水曜日

TeslaとPG&E、世界最大級のエネルギー貯蔵システムの建設を開始

カリフォルニア州の大手電力会社Pacific Gas and Electric Co. (PG&E)とテスラ社は、カリフォルニア州モントレー郡にあるMoss LandingのPG&Eの変電所にて、大規模なリチウムイオン電池貯蔵システム(BESS)の建設を開始しています。容量は182.5MW/730MWhで、現在オーストラリアで稼働している世界最大の蓄電システム(150MW/193.5MWh)を上回ります。

設計、建設、保守はPG&Eとテスラが担当し、建設終了後はPG&Eが所有し、運用することになっています。2021年の第2四半期にシステムが完全に稼働する予定で、20年の稼働期間の間に1億ドル以上のコストが削減できる見込み。CAISOのエナジー市場とアンシラリーサービス市場にも参画予定とのことです。

今年5月、PG&Eは、2023年までにサービスエリア全体に展開される合計1,000MW以上のバッテリー・エネルギー貯蔵プロジェクトの追加契約に署名しました。その中で最大のものは、同じくMoss Landingに設置される送電接続型の300MWのBESSで、容量は1.2GWhとなる見込みです。

(本件はPGEによる所有・運用案件ですが)一般的に、電力会社向けのエネルギー貯蔵設備は、蓄電システムのベンダーにとってはオペレーションコストが低コストで済み、長期的な契約が多いという魅力があります。電力会社への蓄電購入義務も追い風となり、電力会社向けのエネルギー貯蔵設備は、引き続き蓄電システム市場を牽引していくことになるでしょう。

関連ニュース
https://www.cpexecutive.com/post/pge-tesla-kick-off-behemoth-battery-energy-storage-system/


2020年8月4日火曜日

カリフォルニア州、2045年にはゼロ・エミッション・トラック以外の販売を禁止へ

2020年6月25日に採択されたカリフォルニア州大気資源局(CARB)の新規制では、商用トラックメーカーは2024年にゼロ・エミッション・トラックの販売を開始し、2045年までにカリフォルニア州での販売を100%ゼロ・エミッション・トラックとすることが義務付けられました。

この規制により、カリフォルニア州では2030年までに10万台、2035年までに30万台のゼロ・エミッション・トラックが導入される見込みです。

この動きはカリフォルニアだけに留まりません。カリフォルニアでの新規制の決定を受け、カリフォルニア州を含む米国15州とコロンビア特別区のグループは、中・大型電気自動車の市場を拡大し、2050年までにディーゼルエンジンのトラックを段階的に廃止することを目的とした共同覚書を発表しました。

トラックは車の中で最も大気汚染に影響を与えるため、商用フリートの電動化・ゼロエミッション化は以前からよく議論されており、様々な動きがあります。これからも動きを注視していく予定です。

関連ニュース
https://www.greencarreports.com/news/1128652_california-mandate-electric-trucks-all-ev-by-2045#:~:text=Adopted%20Thursday%2C%20the%20Advanced%20Clean,trucks%20in%20California%20by%202045.

https://cleantechnica.com/2020/07/04/zero-emissions-trucks-are-the-future-lets-do-this/

https://www.reuters.com/article/us-autos-emissions-trucks/15-u-s-states-to-jointly-work-to-advance-electric-heavy-duty-trucks-idUSKCN24F1EC

https://finance.yahoo.com/news/happens-california-doesnt-stay-california-174044489.html

2020年7月24日金曜日

COVID19の影響で活用が進むデリバリーロボット

グーグルの本社があるマウンテンビュー市。シリコンバレーの中心とも言えるマウンテンビュー市のダウンタウンでは、以前からロボットや変わった乗り物をよく見かけますが、最近は特に、デリバリーロボットの活用が進んています。

コロナウイルスによるShelter-in-placeが始まって少し経った4月中旬頃から、マウンテンビューダウンタウン付近では、自動運転によるデリバリーロボットが複数台稼働している状況が普通に見られるようになりました。初めこそ珍しくて、写真やビデオを撮っている人が多くいたものの、今はもう住人は見慣れてしまい、ロボットがいる光景はごく普通のことなっています。


試しにアプリをダウンロードしてチェックしてみたところ、約3ドルの宅配費用に加え、商品には通常価格の20%くらいが上乗せされていました。宅配サービスの大手スタートアップ、Instacartと同じ手法です。購入金額の20パーセント増しになることを考えるとそれほど安くはないですが、歩行や荷物の運搬が困難な高齢者の方には、便利なオプションと言えるでしょう。ちなみに、このロボットは話すこともできます。「Hi! I'm Starship, delivery robot!と挨拶して来たことがありました。また、父の日には「Happy Fathers Day!」と話すキャンペーンを行なっていました。

また、宅配ロボットとは別に、自動運転(あるいは自動運転を見越した遠隔操作?)で動いている無人スクーターも4台ほど見かけました。COVID19の影響で外出する人が少なくなっているうちに、様々なロボットの試験や実用化が進みそうです。

2019年12月4日水曜日

米国:2019年後半は家庭用蓄電池の導入が盛んに


Wood Mckenzie社による、四半期毎の蓄電池導入データが更新され、2019年の第3四半期のデータが発表されました(下図参照)。

Federal Tax Creditの活用と、カリフォルニアでの山火事予防のための計画停電への対応のため、2019年後半の家庭用の蓄電池導入は増加傾向となっています。


2019年11月27日水曜日

太陽光発電の落札価格、また世界記録を更新

最近の太陽光発電の落札価格の下がり具合、世界記録の更新具合がすごいです。2019年11月22日の報道によると、ドバイにおける900MWの太陽光発電プロジェクトが、kwhあたり$0.016953で落札されたとのことです(!)。


先日も2019年の発電コストについての分析(下図参照)で、補助金を伴わない風力・太陽光発電の発電コストが既存の石炭・原子力発電所の限界費用(Marginal Cost)と遜色なくなってきていることが示されていましたが、天候の良い特別な場所においては、再エネの競争力がとても高いですね。

久々にびっくりしたので、記事にしてみました。

LCOE 2019 Comparison

2019年6月29日土曜日

米国: 再エネの発電量が石炭を上回る

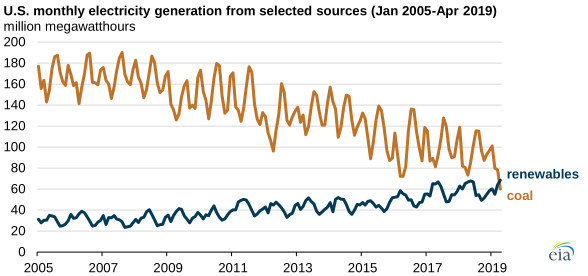
EIAの発表によると、2019年4月は月の発電量ベースで、歴史上初めて、再エネの発電量が石炭による発電量を上回ったとのことです。

石炭産業の回復を約束していたトランプ政権ですが、米国ではトランプが大統領になってからのこの2年で50の石炭火力発電所がリタイアしており、このトレンドは続く見込みです。

U.S. monthly electricity generation from selected sources


2019年5月10日金曜日

PG&E破綻でどうなる?太陽光発電業界への影響・動向

先日、PG&Eの破綻によってカリフォルニア住民の負担が増えることについて書きましたが、エネルギー業界で仕事をしている立場からすると、より気になっているのは、再エネのPPA(Power Purchase Agreement)への影響がどうなるのか、ということです。

PG&Eは現在、損害賠償の額を約142億ドルと推定していますが、その負債を支払うための策の一つとして、破産裁判所(bankruptcy court)に、昔に高価格で締結された再エネのPPA(電力販売契約)の再交渉の許可を求めています。現在は、太陽光発電のPPA価格は昔に比べて格段に下がっています(下図参照)。


source: LBNL


Credit Suisse社の試算では、PG&Eは2012年以前の太陽光発電PPA(7MW以上)を再交渉することで、年間約22億ドル分が回収できる可能性があるとのことです。

一方で、問題を見越して既に太陽光発電プロジェクトの信用格付けは下がっており、そのことによるコスト上昇=PPA価格の上昇が起きています。太陽光発電業者の資金調達環境が悪化することで州の太陽光発電業界の発展に支障がでる可能性があるため、CPUC(California Public Utility Commision)はFERC(Federal Energy Regulatory Commision)に、PG&EによるPPAの再交渉を認めないよう、介入を求めています。


破産裁判所は、激しい法廷での闘争に入る前にPG&EとPPAの相手先企業NextEra Energy Resources など)との間での和解を勧めていましたが、期限である5月3日の時点で、和解には至りませんでした。


今後の動向が注目されます。


関連記事
https://www.greentechmedia.com/articles/read/pges-q1-reveals-sec-investigation-into-public-disclosures-accounting-of-wil#gs.a28ctc
https://www.greentechmedia.com/articles/read/the-looming-bankruptcy-battle-over-pges-renewable-energy-contracts#gs.a29uj5
https://www.utilitydive.com/news/exclusive-pges-future-rests-on-board-picks-cpuc-president-says/551628/


2019年4月30日火曜日

公共交通利用者の変遷可視化ツール

米国の都市における公共交通機関の利用者の変遷を見える化しているサイト「Transit Insights」をご紹介します。

2006年から2017年までの公共交通機関の利用者の変遷を見ることができ、都市毎のデータやトレンドを把握できます。

幾つかの地域を選択して比較することもできます。
例えば以下の図は、2つの地域を比較しており、一つの地域では公共交通の利用者が増加しており、もう一つの地域では減少している様子が見て取れます。


バス・鉄道の利用者の他、公共交通の運用コスト、ガス価格など様々な項目をグラフにして可視化することができます。弊社で行なっていたちょっとしたデータ分析に、このツールが役立ちましたので、皆様にもご紹介まで。

2019年4月19日金曜日

PG&E破綻がカリフォルニア州の住民に与える影響

カリフォルニア州の電力大手PG&E2019129、連邦破産法11条の適用を申請しました。

スタンフォード法科大学院の教授で破産法の専門家であるMarcus Cole教授が、その影響についてインタビューに答えていました。


Marcus Cole教授はカリフォルニアの納税者はPG&Eの責任(Liability)に直接責任を負うわけではないが、電力料金の価格上昇や不動産価値の低下、保険価格の上昇などによって皆の負担が増えると指摘しています。


以下、インタビュー記事よりの抜粋。

"Q:Are taxpayers in California ultimately responsible for PG&E’s liabilities?
A: Strictly speaking, taxpayers are not directly responsible for the PG&E’s liabilities, but the economics of the situation ultimately cost everyone in California in some way. First, it will be more expensive for ratepayers to receive electric power in California, because, as customers of the utility, they are the source of revenue necessary to cover these expenses associated with PG&E’s operations. Furthermore, even Californians who are not PG&E customers are likely to pay indirectly, in the form of lower real estate values, higher insurance rates, and even higher electric power rates from other, similarly situated providers who must account for the risks exposed by PG&E’s fires."

2019年3月30日土曜日

シリコンバレーのCCA - 2018年の状況

先日、家にPG&EとCCAであるSVCE (Silicon Valley Clean Energy)から、ハガキが届きました。(CCAについての説明はこちら

'Understanding Your Energy Choice'と題されたハガキには、PG&Eの電力料金とSVCEの電力料金の比較(2018年)がされています。

SVCEのdefaultメニューとなる「GreenStart」の料金はPG&Eの電力料金よりも少し安くなっています(月の平均料金が$114.87 vs. $111.84)。

また、電力MIXの内訳の比較もなされています。これによると、SVCEエリア内の住民は実質、55%が再生可能エネルギー、45%が大型水力発電からの電力を供給されており、100%カーボンフリーの電力が供給されていることになります。(物理的にではなく、仮想的にですが)。

Campbell, Cupertino, Gilroy, Los Altos, Los Altos Hills, Los Gatos, Milpitas, Monte Sereno, Morgan Hill, Mountain View, Saratoga, Sunnyvaleの住民は、オプトアウトしていない限り、100% carbon freeの電力を使っていると言えます。

ところで、CalCCA(California Community Choice Association)は、カリフォルニア州内のCCAs(Community Choice Aggregators)による再エネの長期契約(PPAs:Power Purchase Agreements)が2018年に10月に合計2,000 MW(2 GW)を超えたと発表しています*。

2017年にはカリフォルニアにおけるCCAの再エネ長期契約の総量は約1000MW(1GW)だったことから、この1年で約2倍に伸びたことになります。


*source: https://www.elp.com/articles/2018/11/california-ccas-double-renewable-energy-commitment-adding-1-gw-capacity-in-one-year.html

石油メジャー企業の持つ二つの顔

第一四半期が終わり、ようやくホッと一息ついています。

さて、今日は石油関連企業の動向についてです。近年、石油メジャー企業によるスタートアップ投資や買収の勢いは凄まじいです。

中でも先頭を走るShellは、最近、電気自動車充電インフラ提供のGreenlotsや蓄電池システム提供のSonnenなどのスタートアップ買収を発表して話題になっています。

今回面白いと思ったのは、非営利のコミュニティ利益会社InfluenceMapが出していたレポートです。

こちらによると、スーパーメジャー5社の設備投資のうち「低炭素(Low Carbon)」に関するものはわずか3パーセントだけ、また、ロビー活動やブランディング活動の予算のうち「気候(Climate)」に関するものは25パーセントとなっています。

それから、昨年11月の選挙では、ワシントン州での炭素税導入を始め様々な環境関連政策が妨げられましたが、その背後には石油企業の懸命なロビー活動もありました。

電気自動車一つとってみても、例えばShellは電気自動車充電関連の企業への投資や買収を加速する一方で、連邦政府によるEV tax creditに反対する石油業界団体のロビー活動にも参加しており、一枚岩ではありません。

石油企業は二つの顔を持ち、複雑なバランスを取っているようにも見えます。ただ一つ言えることは、社内でも様々な立場の人がいる中で、新しい事業創生を担う人たちはそこに注力し、企業全体としてはその勢いを止めない。この勢いが、変化の激しい時代に於いては、必要な勢いだと思います。

【追記】この記事を書いた直後(2019年4月2日)に、Shellは米国における石油業界団体のロビー活動から脱退することを発表しました。気候変動対策方針への不一致が原因とのこと。

2019年1月12日土曜日

サンフランシスコベイエリアの将来シナリオ

明けましておめでとうございます。本年もよろしくお願いいたします。

さて、今日はサンフランシスコ・ベイエリアの都市計画に関するNPO法人SPUR(San Francisco Bay Area Planning and Urban Research Association)が昨年出していた、ベイエリアの将来シナリオについての資料を紹介します。

「Four FutureScenariosfor theSan FranciscoBay Area」と題されたこの資料では、Critical UncertaintiesとしてEconomy, Housing, Transportation, Physical Formの問題を挙げ、External ForcesとしてClimate Change, Earth Quakes,そして The Federal Governmentを挙げています。「地球温暖化」や「地震」と並列で「連邦政府」が挙げられているのに思わず笑ってしまいましたが、それだけ連邦政府の動向がインパクトを与えるということでしょう。

Conclusionとして以下のように纏められていますが、Housingの問題やTransportationの問題の解決が、ベイエリアの持続可能な発展には急務だということが強調されています。

”Our region today has so much going for it: A diverse and open culture that embraces many kinds of innovation. A highly educated population. A network of walkable urban neighborhoods and fine old buildings. Beautiful natural scenery and iconic landmarks that make it famous around the world. And, of course, a powerful economic engine that generates new ideas, new companies and new jobs with seemingly limitless potential.
 But the tremendous success of the Bay Area economy has had unintended consequences. We have not grown the region’s physical form — especially housing stock and transportation capacity — at the same pace we have grown our economy. High housing costs are pushing people to the edges of the region and commutes are becoming untenable. Homelessness is overwhelming public life and services. If left unaddressed, these forces could take the region down a path of extreme inequality and, eventually, economic decline.
 It’s not too late to correct course, but doing so requires us to think deeply about how we got here — the decisions, chains of events and values that led to our current situation. By exploring several possible futures, we can better understand the outcomes of the decisions we make today and use that foresight to shape a better tomorrow for all of us who call the region home."

技術が目覚ましいスピードで進化し、イノベーションが次々と起きていくこの地ですが、「持続可能な発展」について考えている人々・取り組んでいる人々も多くいます。これからの数年は、「持続可能な発展」への取り組みの重要性がより一層増してくるでしょう。

2018年10月13日土曜日

いよいよ進む?都市における車走行データの共有

先日、Uber, Lyft, Fordが都市データのシェアリングでSharedstreetsと提携、というニュースがありました。その一環として、Uberが今後数ヶ月のうちにストリートセグメントレベルの速度データを無料で公開すると発表しています。
SharedStreetsはNational Association of City Transportation Officials (NACTO) 及び
Open Transport Partnershipがローンチした交通データの標準及びプラットフォーム

今回、Uberの出しているUber Movementという都市計画ツールで、現在はどのようなデータが見られるのかを試して見たところ、過去のTripの所要時間の平均が結構細かく見られることがわかりました。現在地と行き先を指定すれば、所要時間の平均を設定した期間別、時間帯別、曜日別などに見ることができます。

なお、UberがInsightとして出していた、「2016年のロンドンのTower Bridgeの閉鎖によるTravel時間への影響」の分析が少し面白かったです。
ちなみに私も、2017年にサンフランシスコでSalesForceのイベントがあった時(注:サンフランシスコ中が混むイベントの代表例)は所要時間にどのような影響があったのかをUber Movementのデータを基にチェックしてみたところ、やはりイベント時には所要時間が増えていたことが確認できました。

フォード社は今回の提携で「路上空間の需要や有無をリアルタイムで示すのに利用できるユニバーサルなデータ標準の策定に取り組む」とのことです。スタンダードが整備されていくことは、データの共有・さらなる活用を促進すると思いますが、一方で、データが企業の宝となり重要な戦略決定を担うこの時代、criticalなデータに関しては自社で持ち、共有できる範囲でデータを共有していく、ということになるでしょう。企業ごとのデータ活用・ビジネス戦略が益々重要になってきます。